TL;DR: This page gives you a working Excel cycle count template — ABC classification, a recurring count schedule, blind count sheets, recount tolerances, a root-cause log, and a monthly completion dashboard — plus the seven steps to build the same workbook yourself. Cycle counting reduces reliance on stressful wall-to-wall stock takes by using small, scheduled counts: high-value A items get counted every month, while low-value C items only need a yearly check.
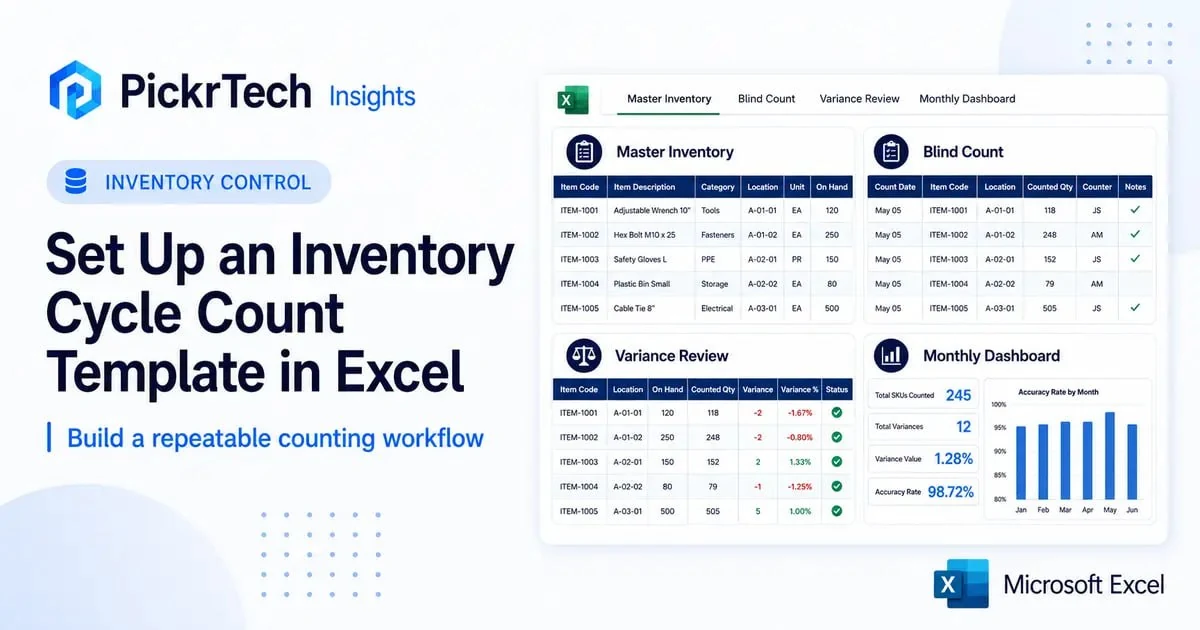
The Excel template connects the master list, blind counts, variance review, and monthly reporting in one workflow.
- Classify every item as A, B, or C by annual usage value, so counting effort follows financial risk.
- Record blind counts in an append-only log and let class-based tolerances decide which variances trigger a recount.
- Track monthly completion, open recounts, and unresolved variances on one formula-driven dashboard.
What’s inside the template
The downloadable workbook contains seven tabs that support the workflow below: a Read Me with the cell legend and every assumption, a Master Inventory item list built as a real Excel Table with a duplicate-ID check, an ABC Analysis sheet that ranks and classifies items automatically, a Count Schedule that flags overdue counts, a Blind Count Entry log that deliberately hides system quantities, a Variance Review sheet with recount tolerances and a root-cause dropdown, and a Dashboard that summarizes the month automatically. Formulas come pre-filled for up to 500 items and 1,000 count events; typing a new item directly below the Master Inventory table flows through classification, the schedule, and the dashboard without editing a single formula.
Download: pickrtech-inventory-cycle-count-template.xlsx
The file ships with 20 fictional sample items and eight sample count events so you can see every rule firing before you trust it with real stock: one overdue count (SKU-1001’s schedule date is deliberately left stale so the OVERDUE flag fires), a variance inside tolerance, a recount that confirmed a receiving error, a zero-quantity bin that turned out to contain two “phantom” units, and the same item counted twice three weeks apart to show how the append-only log handles repeat counts. Before live use, replace the sample inputs in Master Inventory!A2:F21, clear Count Schedule!E4:E23, clear Blind Count Entry!A2:C9 and F2:G9, and clear Variance Review!L4:L11 and N4:O11. Preserve the pre-filled formula cells and rows. The workbook uses INDEX/MATCH rather than XLOOKUP, so its formula set remains compatible with Excel 2016 and later. Google Sheets import behavior has not been independently verified; test the imported file before relying on it for live inventory decisions. Every formula in the file was recalculated and checked against these sample cases before publication.
Before you begin: What you’ll need
Excel version. The downloadable template works in Excel 2016 or newer. If you build the workbook yourself and want to use XLOOKUP, note that XLOOKUP is available in Excel 2021, Excel 2024, and Microsoft 365, but not in Excel 2016 or 2019. Every step below that uses XLOOKUP includes a VLOOKUP or INDEX/MATCH alternative for older versions.
Data. Export a raw extract from your current inventory or accounting system with, at minimum, an Item ID (or SKU), a description, and the system quantity for every product. For ABC classification you also need each item’s annual usage value — annual units used or sold multiplied by unit cost. If you have no usage history yet (a new business or a new product line), you can substitute on-hand stock value as a temporary proxy and re-classify once real usage data exists.
Cycle counting verifies an inventory process — it doesn’t define one. If you haven’t yet decided which fields, locations, and owners your inventory records need, work through our inventory management checklist for small business first, then come back here to build the recurring count routine on top of it.
Estimated time: about 30 minutes to adapt the download using the first-session order below; about 60 minutes to build the workbook from scratch.
Difficulty: Intermediate
How the ABC math decides how often you count
ABC classification applies the Pareto principle to stock: a small share of items usually carries most of the value, so those items deserve the tightest control and the most frequent counts. In the template’s sample data, 20 items carry a combined annual usage value of $137,452.50 — and just five of them (25% of the catalog) account for 78% of it:
| Rank | Item | Annual usage value | Cumulative % | Class |
|---|---|---|---|---|
| 1 | Cordless Drill Kit 18V | $37,380 | 27.2% | A |
| 2 | Circular Saw 7-1/4 in | $27,090 | 46.9% | A |
| 3 | Li-Ion Battery Pack 4Ah | $22,420 | 63.2% | A |
| 4 | Rotary Laser Level | $14,155 | 73.5% | A |
| 5 | Safety Goggles 12-Pack | $6,240 | 78.1% | A |
| 6 | Screwdriver Set 24-Pc | $5,760 | 82.2% | B |
| 11 | Wood Screws #8 Box 500 | $2,040 | 95.5% | C |
The template turns each class into two operating rules — a count frequency and a recount tolerance:
| Class | Cumulative value cutoff | Count frequency | Recount tolerance |
|---|---|---|---|
| A | Top 80% | Every 30 days | 0% — any variance triggers a recount |
| B | 80–95% | Every 90 days | 2% of system quantity |
| C | Above 95% | Every 365 days | 5% of system quantity |
These cutoffs, frequencies, and tolerances are PickrTech editorial defaults, not industry mandates — they sit in editable yellow assumption cells in the workbook so you can tighten or loosen them to match your own shrinkage risk. Two rules are fixed regardless of your settings: a zero-quantity item that turns out to contain stock always triggers a recount, and counting A items more frequently than B and C items is the standard practice that makes cycle counting work at all.
Step-by-step walkthrough
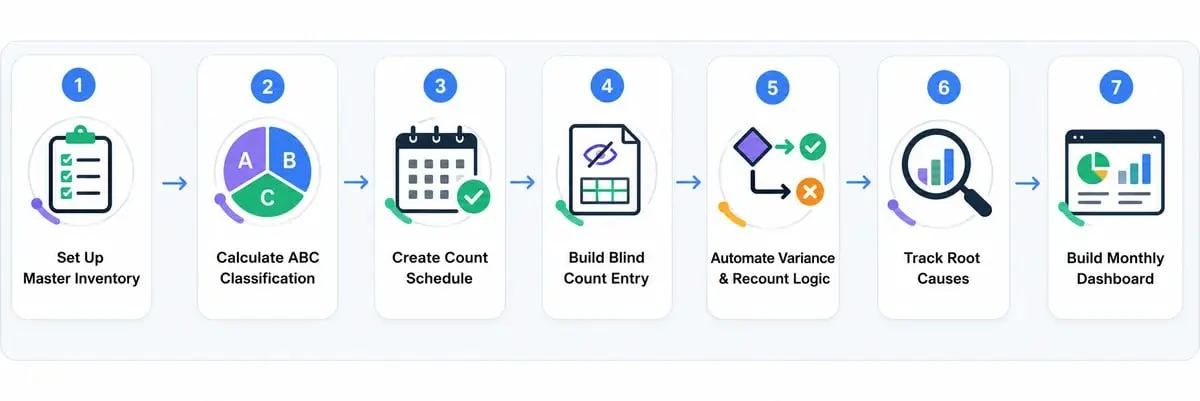
Step 1: Set up the Master Inventory list
Every other sheet references this tab, so it has to be clean before you build anything on top of it. Import your raw extract into a tab named “Master Inventory” and format it as an Excel Table (Ctrl+T, or Cmd+T on Mac) named MasterInventory. You need these columns: Item ID, Description, Location, Unit Cost, System Quantity, and Annual Usage Qty.
Add two calculated columns: Annual Usage Value (Unit Cost × Annual Usage Qty — this drives ABC classification) and On-Hand Value (Unit Cost × System Quantity — useful for reporting, but don’t classify on it if usage data exists). Then add a Duplicate ID Check column, because a duplicated SKU silently corrupts every lookup downstream:
=IF(COUNTIF($A:$A,A2)>1,"DUPLICATE","OK")
Expected result: A real Excel Table that extends automatically when you type a new item directly below it, with every Item ID confirmed unique and both value columns calculating.
Step 2: Calculate ABC classification
Create a tab named “ABC Analysis”. Pull in Item ID and Annual Usage Value, sort the sheet descending by Annual Usage Value, then compute the cumulative value down the column (=SUM($C$2:C2)) and the cumulative percentage (cumulative value ÷ grand total). Assign the class with:
=IF(E2<=0.8,"A",IF(E2<=0.95,"B","C"))
where column E holds the cumulative percentage. One caveat that catches people later: this sort-based approach only works while the sheet stays sorted descending by value, so re-sort after any change to costs or usage quantities. The downloadable file takes a different route — it ranks items with RANK and INDEX/MATCH helper formulas, so it reclassifies itself automatically without manual re-sorting. Pick whichever approach fits your comfort level.
Expected result: Every item carries an A, B, or C class derived from its share of annual usage value, matching the worked example above.
Step 3: Create the count schedule
Open a tab named “Count Schedule”. Pull in Item ID, Description, and ABC Class — with XLOOKUP on Microsoft 365, or with INDEX/MATCH on any version, for example:
=INDEX('ABC Analysis'!$F:$F,MATCH(A4,'ABC Analysis'!$A:$A,0))
Add a Count Frequency column that reads the assumption cells (30 days for A, 90 for B, 365 for C), a Last Count Date column you update after every completed count, and a Next Count Date column that simply adds the frequency to the last count date. Finally, flag anything that slipped:
=IF($F4="","",IF($F4<TODAY(),"OVERDUE","ON TRACK"))
where column F is Next Count Date. Apply conditional formatting to turn OVERDUE cells red — the download ships with these rules built in. Assign one named owner for keeping Last Count Date current, because missed date updates can make schedules quietly fail. The sample data demonstrates exactly this failure — SKU-1001 was counted on July 10 but its schedule date was never updated, so it shows as OVERDUE.
Expected result: A self-updating calendar that tells you exactly which items are due today and flags any that have been missed.
Step 4: Build the Blind Count Entry log
This is the sheet the counter takes to the shelf, and it is deliberately limited in what it shows. Create a tab named “Blind Count Entry” with Count ID, Count Date, Item ID, Description, Location, Counted Quantity, and Counted By. Crucially, do not display the system quantity anywhere on this sheet.
Treat this sheet as an append-only log: every count is a new row with its own Count ID, so a second count of the same item is a new event and never overwrites the first. Blind counting is a standard stock-audit control — in enterprise inventory systems such as Oracle’s PeopleSoft Inventory, a blind count is defined precisely as one where system balance quantities are excluded from the count sheet, forcing counters to enter every quantity themselves. When counters can see the expected number, they tend to “confirm” it rather than count. If your counts involve large bins of small items, pairing this sheet with a barcode scanner and an Excel inventory spreadsheet speeds up entry considerably.
Expected result: An append-only entry log showing only what to count and where — never how many units the system expects.
Step 5: Automate variance and recount logic
Create a tab named “Variance Review” that mirrors the count log row by row, matched by Count ID — this way every count event, including a repeat count of the same item, gets its own independent variance line. For each event, pull the System Quantity from Master Inventory, then calculate the raw variance (Counted − System) and the variance percentage with a guard for zero-quantity items:
=IF(F4=0,IF(H4=0,0,1),ABS(H4)/F4)
where F is System Qty and H is the variance. A bin that should be empty but isn’t scores 100% variance and always fails tolerance. Then compare against the class-based tolerance and produce the first-count result:
=IF(H4=0,"MATCH",IF(I4>J4,"RECOUNT","WITHIN TOLERANCE"))
where I is the variance percentage and J is the tolerance. Prefer strict control? Set every tolerance to 0% and the sheet behaves like a pure any-variance-recounts system. One rule is non-negotiable either way: never adjust the system quantity from the first count alone. A RECOUNT flag means a second count by a different person; only the verified recount quantity gets written back to your system of record.
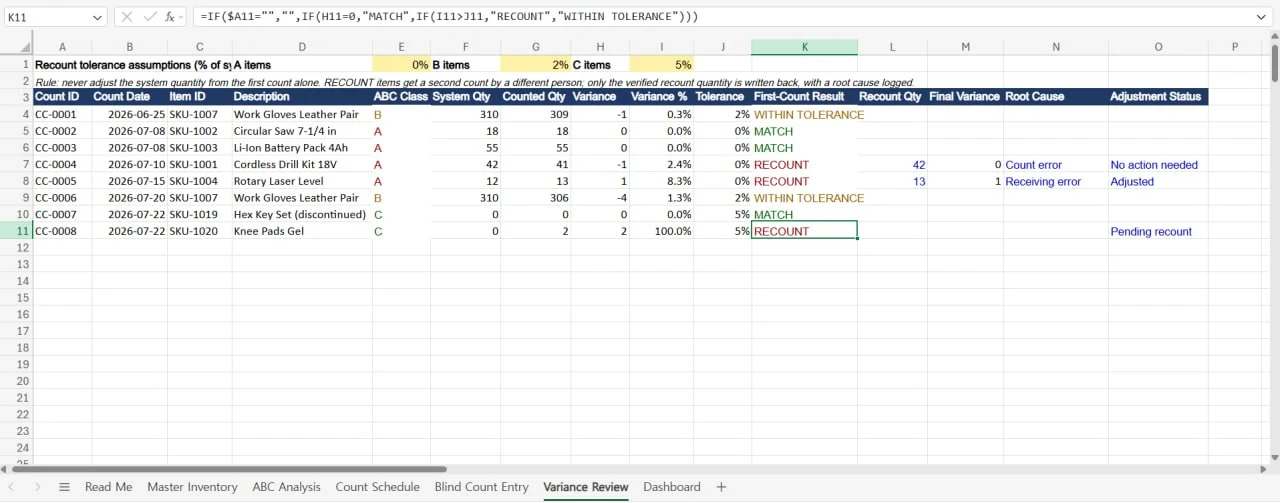
Expected result: Discrepancies are surfaced automatically per count event, and the tolerance rules decide which ones are worth a second trip to the shelf.
Step 6: Track root causes and unresolved variances
When a recount confirms a true variance, your inventory is off and you need to know why. Add a Root Cause column with a data-validation dropdown — Count error, Receiving error, Shipping error, Damage, Shrinkage/theft, Unit of measure error, Unknown — and an Adjustment Status column (Pending recount, Adjusted, No action needed).
Forcing a category on every confirmed variance turns the spreadsheet from a score-keeping tool into a continuous-improvement system: three “Receiving error” entries in a month point at your inbound process, not your counters. The Adjustment Status column is also what lets the dashboard show unresolved variances, so nothing flagged for recount silently disappears.
Expected result: A categorized error log plus a live list of variances still waiting on a recount.
Step 7: Build the monthly completion dashboard
Create a “Dashboard” tab with a short block of COUNTIFS formulas — no refresh button required. The metrics worth tracking every month: scheduled counts due by month-end, due items actually counted, the completion rate, overdue items, first-count pass rate, open recounts, and unresolved variances. The due-count formula looks like this:
=COUNTIFS('Count Schedule'!A:A,"?*",'Count Schedule'!F:F,"<="&EOMONTH(TODAY(),0))
The completion rate then divides the due items that were actually counted this month by that same due population — numerator and denominator describe the same set of items, so the rate can’t be inflated by counts of items that weren’t due. The pass rate counts MATCH and WITHIN TOLERANCE results as passes, which is why it’s a pass rate rather than an exact-match rate. In the sample data this dashboard shows a 50% monthly completion rate (one of the two due items was counted), one overdue item, a 62.5% first-count pass rate, and one unresolved variance — exactly the numbers the sample cases were built to produce.
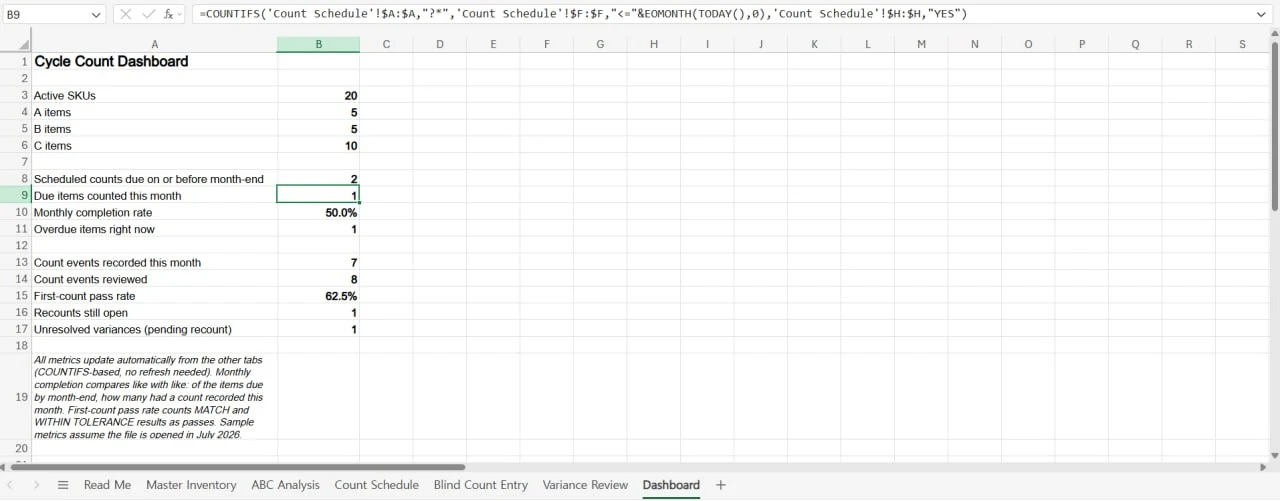
If management prefers a visual, add a PivotTable and PivotChart on the Count Schedule tab with Status and Class in the rows area — but treat it as optional polish; the COUNTIFS block is the part that keeps the process honest.
Expected result: A one-glance answer to “are we actually doing our counts, and is anything unresolved?”
Recommended first 30-minute setup order
1. Get your data in (10 minutes). If you downloaded the template, complete the sample-data cleanup listed under “What’s inside the template,” then paste your own extract into Master Inventory. If you’re building from scratch, import and format the table first — nothing else works without a clean baseline.
2. Check the ABC ranking (10 minutes). Review the cumulative percentages and sanity-check the result: if your top handful of items doesn’t carry most of the value, verify the usage data before trusting the classes.
3. Generate this month’s count list (10 minutes). Filter the Count Schedule to A items due this month and count those first. Ignore the dashboard and root-cause tracking until your first counts are entered and verified — the process earns complexity as it proves itself.
Setup mistakes to avoid
Counting everything at once. The point of an ABC schedule is verifying small slices continuously. Counting all A, B, and C items in the same week just recreates the wall-to-wall audit you were trying to reduce.
Showing system quantities on the count sheet. Counters who can see the expected number will unconsciously record it. Keep the Blind Count Entry sheet blind.
Skipping zero-quantity items. An empty bin still needs its 30 seconds of verification. Zero-quantity records are a common source of phantom inventory — the sample data’s SKU-1020, a “zero” bin holding two units, is there to make the point.
Distributing the file with formulas unlocked. Before handing the workbook to counting staff, lock the formula cells and protect the sheets so a stray keystroke can’t delete the variance logic. Input cells (blue text in the template) stay editable.
Common problems and fixes
Lookups return #N/A during count entry. The lookup can’t find an exact match, almost always because of trailing spaces in the Item ID or a text-versus-number formatting mismatch. Wrap the lookup value in TRIM — for example =XLOOKUP(TRIM(C4),MasterInventory[Item ID],MasterInventory[Description]) on Microsoft 365, or =INDEX(MasterInventory[Description],MATCH(TRIM(C4),MasterInventory[Item ID],0)) on any version — and make sure both columns share the same cell format.
Conditional formatting breaks when rows are added. The rule was applied to a fixed cell range instead of an Excel Table. Convert the range with Ctrl+T; rules applied to table columns extend automatically to new rows.
The dashboard shows 0% completion even though counts were entered. The date columns were typed as text, so the date comparisons in the COUNTIFS formulas silently fail. Select the column, go to Data > Text to Columns, choose Date as the format, and confirm your regional date settings match what was typed.
Acceptance test: is your workbook ready?
Before trusting the template with real stock decisions, run these checks — each one mirrors a case the downloadable file’s sample data demonstrates:
- ✓ Master Inventory is a real Excel Table named MasterInventory; typing a new item in the row directly below it flows through ABC Analysis, the Count Schedule, and the dashboard without editing any formulas
- ✓ Every Item ID shows “OK” in the duplicate check, and both value columns calculate
- ✓ ABC classes match a hand-check of the cumulative percentages at the 80% and 95% boundaries
- ✓ Setting an A item’s Last Count Date 40 days back flips its status to OVERDUE
- ✓ The Blind Count Entry sheet shows no system quantities anywhere
- ✓ Recording a second count for an item creates a new log row with its own Count ID instead of returning the first count
- ✓ A zero-quantity item counted at any positive number flags RECOUNT; counted at zero, it shows MATCH
- ✓ A small variance on a B or C item lands WITHIN TOLERANCE, while any variance on an A item flags RECOUNT
- ✓ With two items due by month-end and one of them counted, the completion rate reads 50%
- ✓ A variance marked “Pending recount” appears in the dashboard’s unresolved-variances count
When Excel stops being enough
Excel’s published worksheet limits are far larger than most small-business catalogs, but those specifications do not guarantee a smooth shared counting workflow. The structural limits matter sooner: this workbook does not provide real-time multi-user counting, live sales-channel sync, or a native mobile barcode workflow.
If those pressures sound familiar, the decision framework in inventory spreadsheet vs software: when to switch covers the concrete switching triggers, and our small business inventory management tools comparison breaks down the free-plan limits and 12-month costs of the main options.
Frequently asked questions
Q: How often should I re-run the ABC classification?
A: Quarterly is a sensible default for most small businesses — often enough to catch seasonal shifts and new product lines, rare enough that count frequencies stay stable. Re-run it immediately after any large catalog change. If you built the sheet manually with the sort-based method, re-sort the ABC Analysis tab descending by value each time — the downloadable file re-ranks itself automatically.
Q: How do I handle negative variances, where the count is lower than the system quantity?
A: The same way as positive ones, just with more urgency: recount by a different person, and only if the shortage is confirmed do you log a root cause and adjust the system quantity to the verified count. Repeated confirmed shortages on the same items are a shrinkage signal worth investigating beyond the spreadsheet.
Q: What about items with no recent sales or usage?
A: Zero-activity items naturally fall into class C and an annual count. But if dead stock is tying up meaningful cash, pull those items forward for a one-off count to confirm they physically exist, then decide whether to discount or write them off — an accurate count of unsellable stock is still an accurate count.
Sources and notes
- Microsoft Learn — ABC inventory classification — ABC/Pareto methodology and the practice of counting A items more frequently
- Oracle PeopleSoft Inventory — Setting Up Inventory Counts — blind-count definition (system quantities excluded from count sheets) and tolerance-based reconciliation
- Microsoft Support — XLOOKUP function — usage and version availability
- Microsoft Support — VLOOKUP function — lookup alternative for Excel 2016/2019
- Microsoft Support — Overview of Excel tables — table auto-expansion behavior
- Microsoft Support — Use conditional formatting — status and overdue highlighting
- Microsoft Support — Apply data validation to cells — root-cause dropdown lists
- Microsoft Support — Protect a worksheet — locking formula cells before distribution
- Microsoft Support — Create a PivotTable — optional dashboard visual
- Microsoft Support — Excel specifications and limits — worksheet scale limits
Disclaimer
This guide is for general informational purposes only and does not constitute professional accounting, tax, legal, or financial advice. Excel feature availability and product details were verified against official vendor documentation as of July 2026 and may change without notice. The classification cutoffs, count frequencies, and recount tolerances described here are editorial defaults — adapt them to your own operations. Always consult a qualified professional for advice specific to your business situation.
Last reviewed: July 2026 by the PickrTech editorial team.